


V-Report

Report all data from energy production to trade comprehensively and analyze portfolio performance.
V-Report
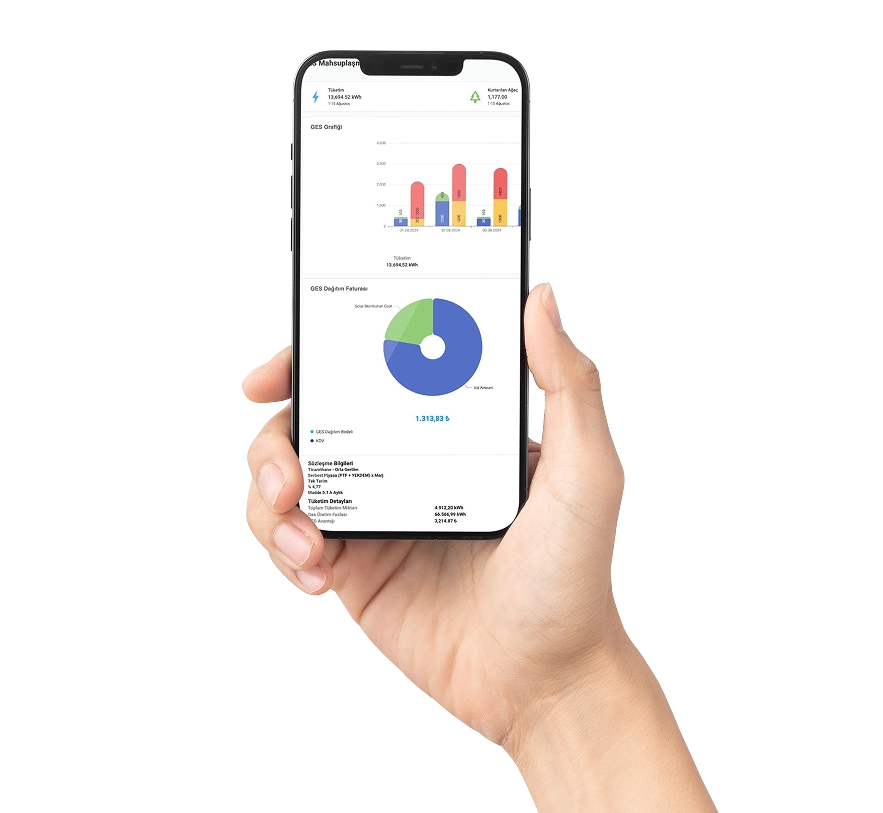
V-Report combines your operational data from the V-Gen product family with energy market data under a single roof, delivering powerful and meaningful reports running on the Power BI infrastructure. Its interface, perfectly aligned with the familiar V-Gen interface, provides a seamless and holistic user experience. These rich reports, available in hourly, daily, monthly, and yearly formats, empower energy professionals to make data-driven decisions.
V-Report’s Advantages
Accessing, compiling, and interpreting energy market data is often a complex and time-consuming process. This data, published from different sources, in different time periods, and often at an hourly frequency, poses a risk of errors and reduces operational efficiency when compiled manually.
V-Report solves this problem for you. Its intelligent data engine, operating in the background, seamlessly aggregates data from various market sources, making it reliable and ready for use. Thanks to ready-made report sets designed and developed by energy professionals specifically for energy market players with different license types, accessing data is now as easy as understanding it.
For facilities where both production and consumption coexist, your energy decisions are built on a much more holistic basis with specialized analyses that combine cost and profitability perspectives.
Conciliation Reports
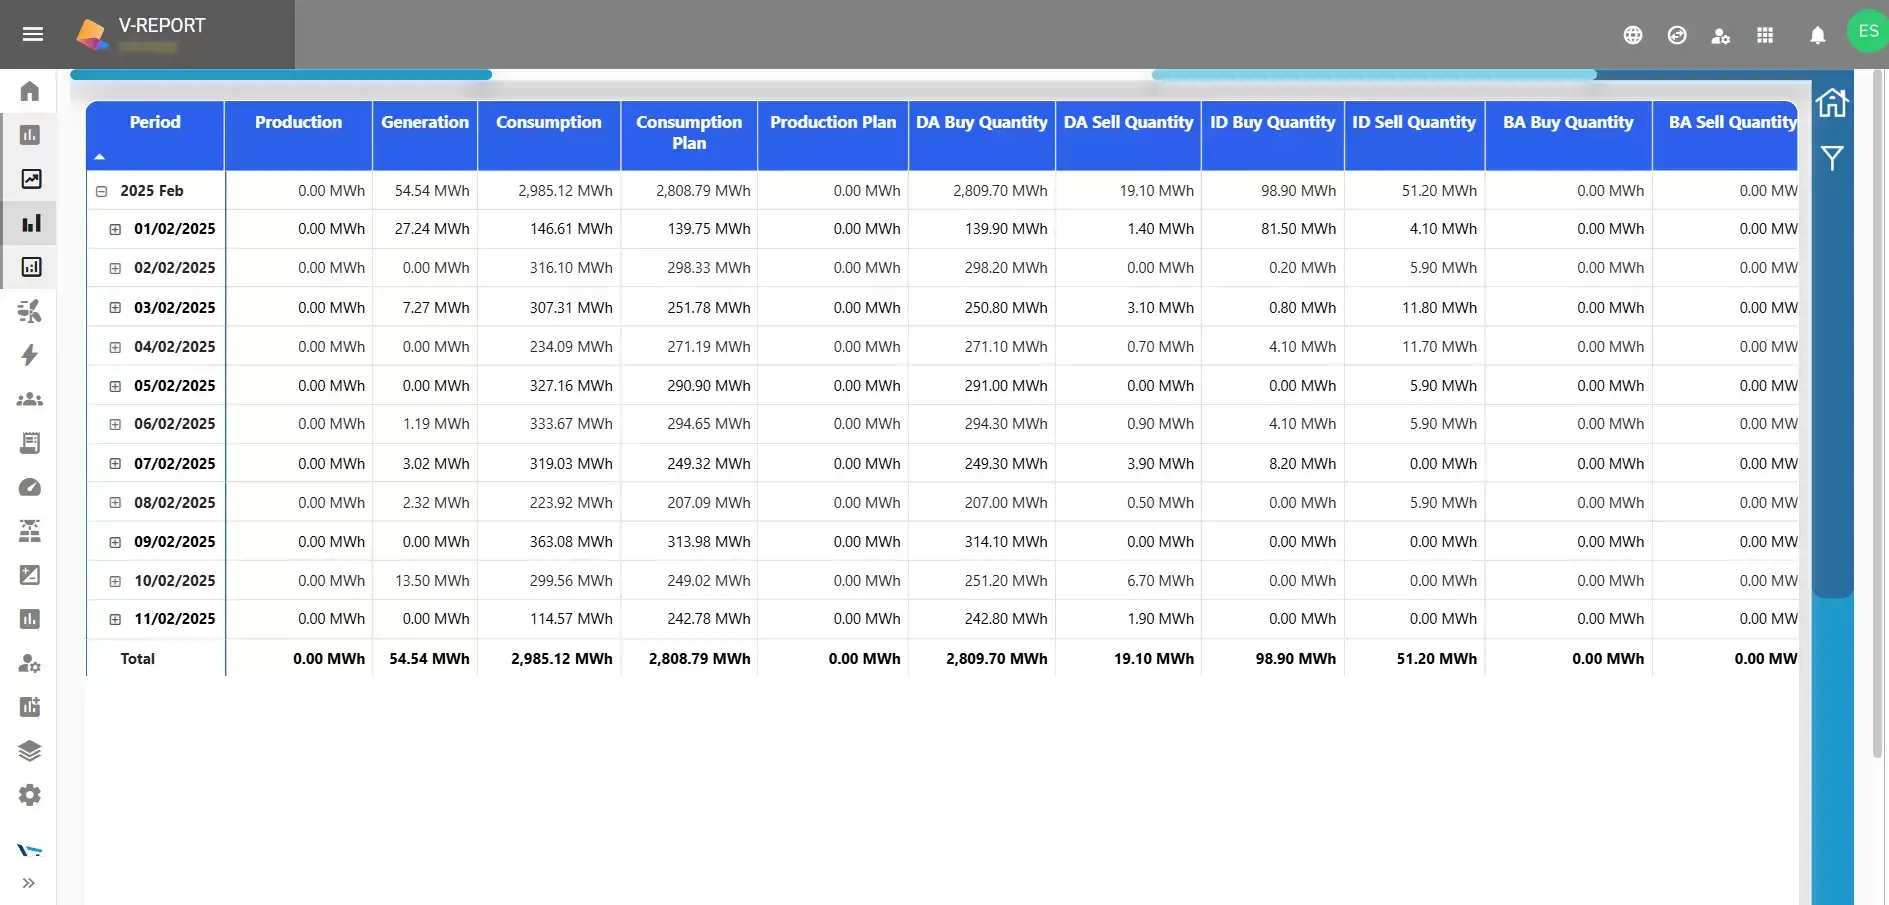
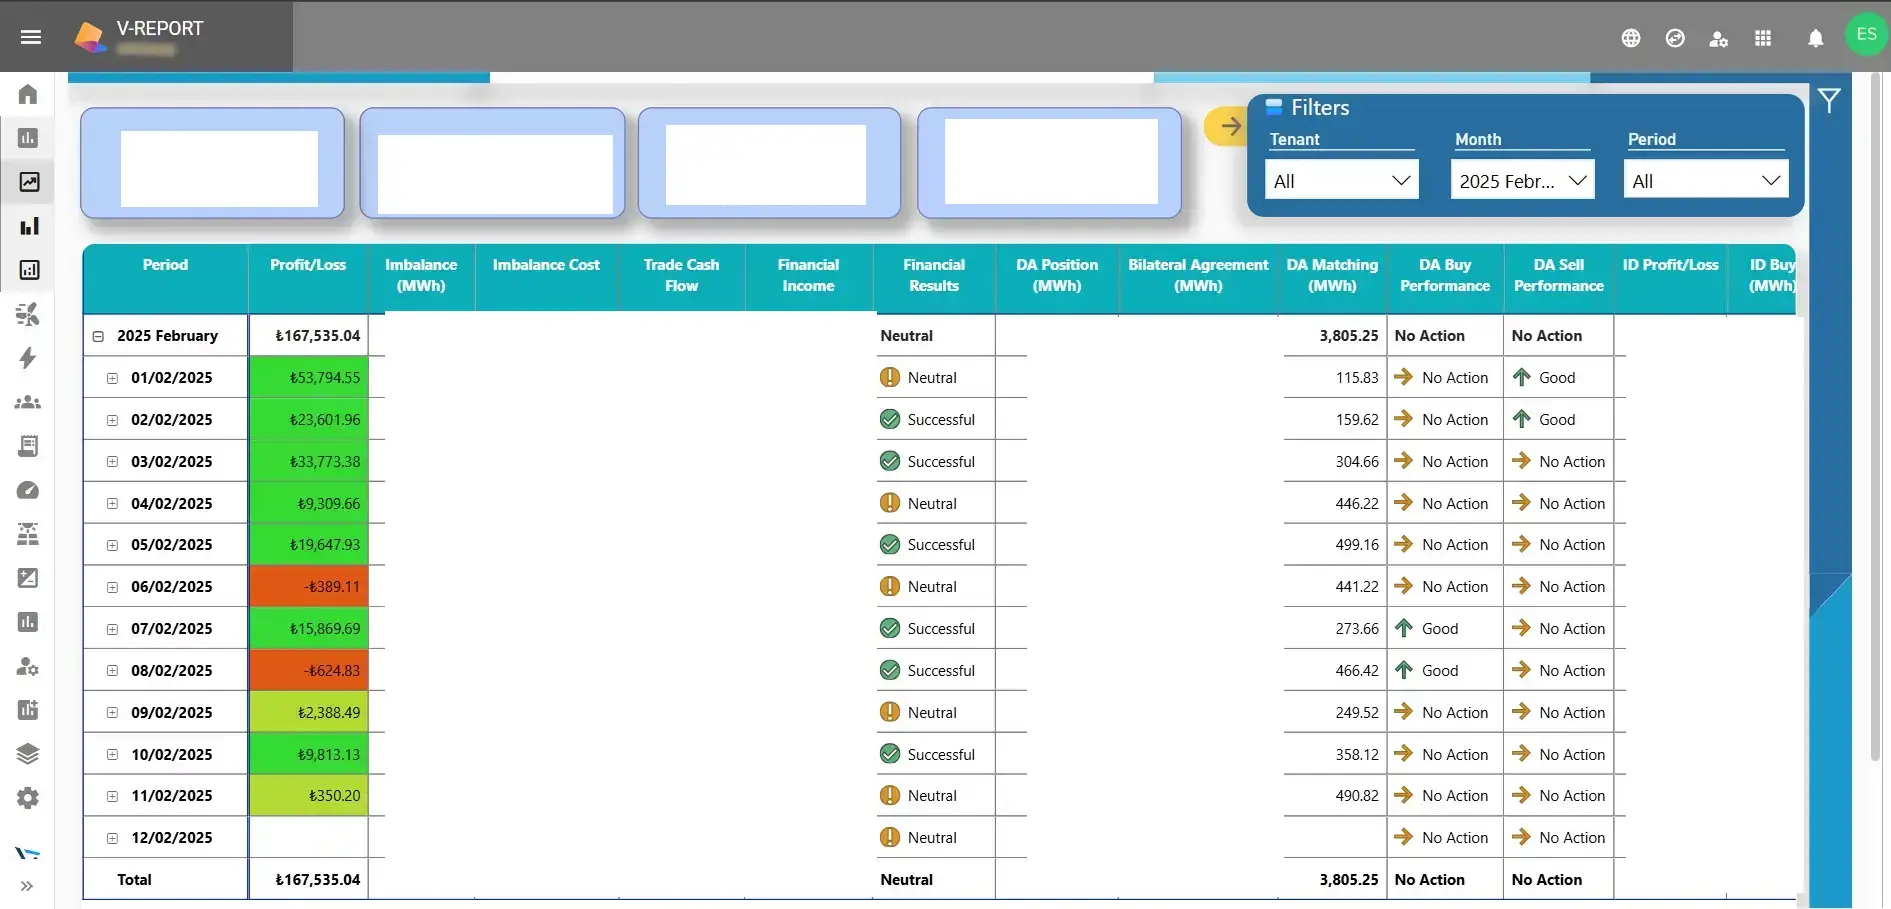
Displays EXIST settlement items by portfolio, plant, or customer level, visualizing imbalance, market operation, and cost allocations on a single screen.

Portfolio-Based Reports
Analyzes each generation, consumption, or trading portfolio individually, combining revenue, cost, imbalance, and performance data under one unified view. Enables cross-portfolio comparison, consolidated insights, and strategic decision support.

Imbalance Reports
Analyzes real-time deviations between generation and consumption, providing data-driven insights to minimize imbalance costs.

IDM Analysis Reports
Visualizes intra-day market prices, hourly match rates, and arbitrage opportunities to support optimized trading strategies.

Consumption Cost Details
Analyzes unit prices, demand profiles, and total cost breakdowns for each consumption point, enabling financial visibility per facility.
Production Profitability Analysis
Matches generation data with market prices to deliver income-expense analyses and profitability trends per power plant through dynamic visuals.
Forecast Performance Reports
Compares V-Forecast predictions with actual outcomes, quantifying forecast accuracy and reporting model performance metrics.
Advance Report
Consolidates market revenues, advance payments, and offset amounts, simplifying cash-flow tracking for energy portfolios.
For energy trading transactions conducted under a single license, all items subject to reconciliation are separated at the portfolio level.
You can separate your monthly operations at the physical meter level, as well as at the virtual portfolio level, grouped for consumption and production forecasting.
This ensures that a single invoice issued by the market operator is allocated to each portfolio in a manner consistent with your operations.
Thanks to reports designed, tested, and continuously updated by professionals active in the energy sector, you’ll find the information you need in the most accurate format.
These reports are individually tailored to meet the needs of different energy market players.
In structures where production and consumption facilities from different sources are combined, both cost and profitability perspectives are combined to provide a clear financial overview.
The financial status of each facility can be monitored individually, while the impact of different facilities on the bottom line can be easily demonstrated within the overall picture.
Energy market data, published hourly, is automatically collected, cleaned, and prepared for reporting in the background. No more manual handling of complex data sources.
Energy market data, published hourly, is automatically collected, cleaned, and prepared for reporting in the background. No more manual handling of complex data sources.
Energy market data, published hourly, is automatically collected, cleaned, and prepared for reporting in the background. No more manual handling of complex data sources.
V-Report Working Method
V-Report has an intelligent data infrastructure that works behind the scenes to streamline your energy management processes. Operational data from other V-Gen products, along with data from the energy market (e.g., Market Clearing Price, Imbalance Prices, values, etc.), are regularly collected from various sources and frequencies.
This data is automatically cleaned, standardized, and correlated by V-Report’s data infrastructure. This brings together production, consumption, forecasting, reconciliation, cost, and revenue data on a single platform.
This entire dataset is transformed into meaningful reports with a powerful Power BI-based analytics infrastructure and presented in a user-friendly interface, fully integrated with the V-Gen interface.
Manual data processing is eliminated, and timely, reliable, and holistic reports are at your fingertips.
Understand Energy Conversions


İletişim Formu Aydınlatma Metni
VTC TEKNOLOJİ ENERJİ LİMİTED ŞİRKETİ
KİŞİSEL VERİLERİN İŞLENMESİ İLETİŞİM FORMU AYDINLATMA METNİ
VERİ SORUMLUSUNUN KİMLİĞİ
VTC TEKNOLOJİ ENERJİ LİMİTED ŞİRKETİ 6698 sayılı KVK Kanunu kapsamında "Veri Sorumlusu" sıfatına sahiptir.
İŞLENEN VERİLER VE AMAÇLAR
İletişim formu aracılığıyla paylaştığınız ad, soyad, e-posta adresi ve telefon numarası ile mesaj içeriğiniz; talebinizin yanıtlanması, iletişim faaliyetlerinin yürütülmesi ve müşteri ilişkilerinin yönetilmesi amaçlarıyla işlenmektedir. Hukuki dayanak: veri sorumlusunun meşru menfaati ve sözleşme kurulması.
VERİLERİN AKTARILMASI
Kişisel verileriniz; yasal yükümlülükler kapsamında kamu kurumlarına, teknik altyapı hizmeti alınan yurtiçi tedarikçilere aktarılabilir.
HAKLARINIZ
KVK Kanunu'nun 11. maddesi kapsamındaki haklarınızı aşağıdaki iletişim kanallarıyla kullanabilirsiniz:
VTC TEKNOLOJİ ENERJİ LİMİTED ŞİRKETİ
Adres: Seymen Mahallesi D-130 Karayolu Caddesi No: 69, 41245 Başiskele / Kocaeli
Telefon: +90 262 311 11 51
E-posta: [email protected]
KEP Adresi: [email protected]